
rust
Profiling the UI Itself: A CPU+GPU Flamegraph and RenderDoc-Style Replay Viewer for GPUI
Building a feature-gated CPU+GPU profiler directly into GPUI's Inspector panel: span capture, counters, memory snapshots, a RenderDoc-style GPU deep capture and replay engine, and a flame chart rendered with a custom instanced GPU shader instead of one UI element per bar.

A Different Kind of Profiler
Helio has a GPU profiler already: per-pass timestamp queries, a live telemetry portal, an on-screen HUD. It answers "which render pass is expensive" very well. It has nothing to say about why a button's hover state took 40ms to apply, what the element tree looked like the frame a panel flickered, or whether the GPU actually started a frame before the CPU moved on to the next one. Those are UI-framework questions, not renderer questions, and GPUI, the UI framework we maintain as our own fork WGPUI for the Pulsar editor, had no way to answer any of them.
This post walks through what we built instead: a capture engine living inside GPUI itself, feature-gated to compile to nothing when unused, a counters and memory system riding alongside it, an on-demand GPU deep capture with a full replay engine, a UI-tree snapshot that reconstructs the element tree after the fact, and a Profiler tab in the Inspector panel that ties all of it together, including a flame chart rendered through a custom instanced GPU shader rather than GPUI's own element tree.
Recording Spans for Free
The instrumentation had one hard constraint from the start: with the flamegraph cargo feature off, none of it should exist in the compiled binary. Every capture call site is gated:
Even with the feature compiled in, an instrumentation site costs one relaxed atomic load and a branch when nothing is recording. CAPTURE_ENABLED only flips true for the seconds someone is actually capturing, and that's the only window where the rest of the machinery runs.
A CpuSpan is a name, a category, an optional ElementAttribution (the type_name::<E>() of whatever GPUI element the span belongs to, plus a hash of its GlobalElementId), a depth, and a start/end pair. GpuSpan mirrors it on the GPU side, tagged with a GpuPassKind (main, main_resumed, filter_group, filter_group_resumed) and calibrated from the GPU's own clock into the same nanosecond timeline the CPU spans use. FrameCapture bundles a frame's CPU spans, background-thread spans, and GPU spans together, and Capture holds a ring buffer of those, bounded by max_frames so a long recording session doesn't grow without limit.
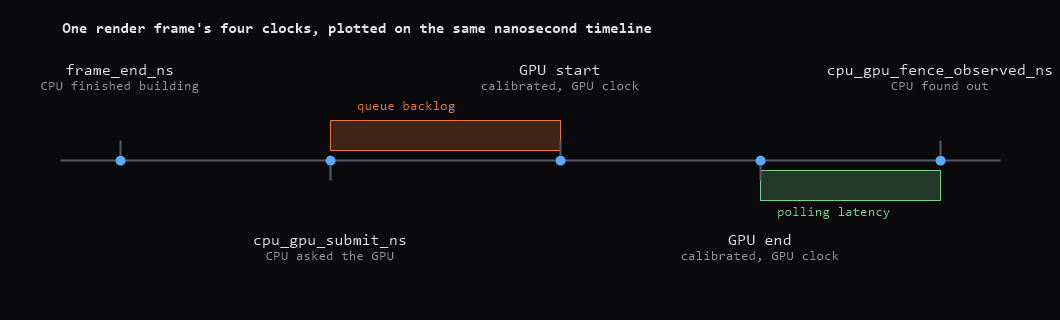
The two fields that mattered most to get right sit on FrameCapture itself, because a render frame doesn't have one clock, it has four:
Four instants on one timeline: frame_end_ns when the CPU finishes building the command buffer, cpu_gpu_submit_ns when it hands that buffer off, the calibrated GPU span start and end from the GPU's own clock, and cpu_gpu_fence_observed_ns when the CPU's non-blocking poll finally notices completion. The gap between submit and the calibrated GPU start is queue backlog. The gap between the calibrated GPU end and the fence-observed time is pure polling latency with no GPU work in it at all. Plot all four on the same timeline and the two gaps become visually distinct instead of collapsing into one "frame time" number.
Counting and Remembering
Alongside span timing, FrameCounters tracks the things you'd want when timing alone doesn't explain a slow frame: DrawCallCounters broken down by DrawCallKind (quads, shadows, underlines, mono and poly sprites, backdrop filters, paths, surfaces), AtlasCounters for tile-allocator activity, and EventCounters for input and notification volume. CounterSummary aggregates a whole capture's worth of these into means, maxes, and a computed FPS (from the actual span between the first and last frame in the window, not the reciprocal of mean frame duration, which hides idle time between draws).
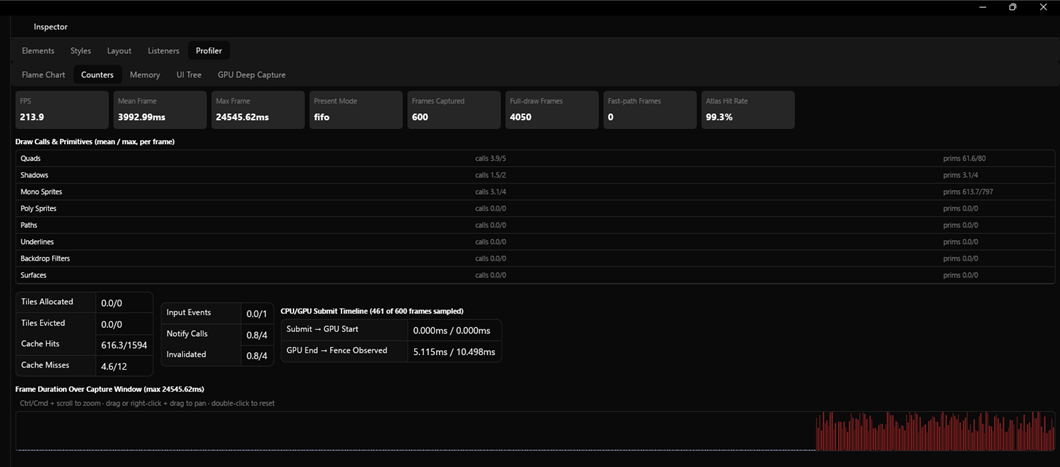
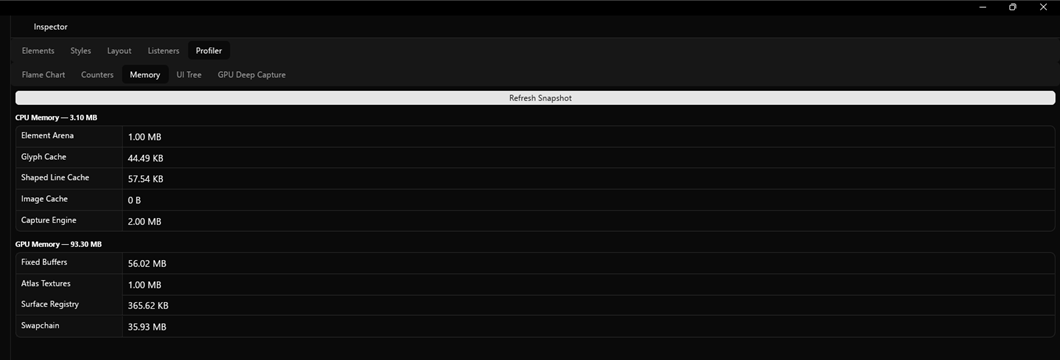
Memory gets the same treatment. MemorySnapshot covers the CPU side: the per-frame element arena's reserved capacity, text system cache sizes, loaded image bytes across every registered image cache, and the capture engine's own live footprint, its per-thread span ring buffers and whatever a running capture is currently holding. GpuMemorySnapshot covers the GPU side: the fixed-size quad/shadow/sprite/path/underline/backdrop-filter buffers, atlas texture memory across monochrome and polychrome pages, the surface registry's triple-buffered offscreen textures, and a best-effort estimate of the swapchain's own backing textures (wgpu doesn't expose the presentation engine's actual image count, so this uses desired_maximum_frame_latency as a stand-in). Both snapshot types get correlated back to the frame they were taken alongside, so a memory spike and a timing spike in the same frame show up as the same frame in the viewer.
Freezing a Frame's Entire GPU State
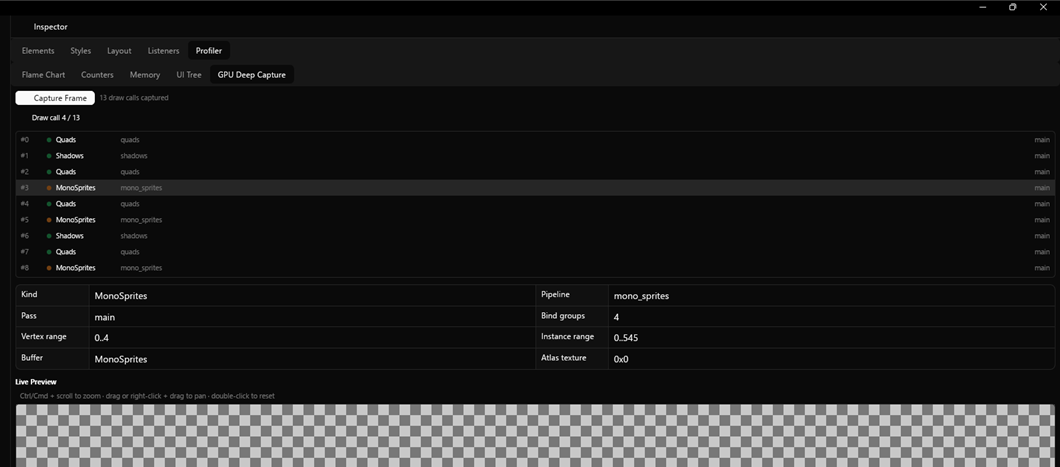
The always-on capture engine tells you when things happened. It doesn't tell you what the GPU actually drew. That's what the on-demand deep capture is for: trigger it once, and it records the complete command stream for exactly one WgpuRenderer::draw() call, not a summary of it.
Each entry in that stream is a DeepCaptureDrawCall: its sequence number, which DrawCallKind it issued, the wgpu::RenderPipeline label bound for it (which doubles as shader identity, since each draw call kind maps to exactly one pipeline), which render pass it went into, its vertex and instance ranges, and, depending on kind, either an atlas texture id, a surface id, or a reference to one of the renderer's seven fixed resource buffers:
Alongside the draw-call stream, the capture reads back the full contents of every fixed buffer touched by at least one of those calls, once per buffer rather than once per call, since a buffer is typically referenced by many draw calls in a single frame and reading it back seven times instead of hundreds is the entire difference between a capture that's cheap and one that stalls the frame it's trying to record. Phase 4b extended the same once-per-resource idea to texture content: atlas pages and composited surfaces both get their actual pixel bytes read back, tightly packed with wgpu's row-alignment padding already stripped out, identified by an id that encodes whether it's an atlas page or a surface and which one.
The replay side, DeepCaptureReplay, steps through that recorded stream and reports, per draw call, whether it has everything it needs to redraw faithfully: real captured bytes for both the geometry buffer and (for sprite calls) the atlas texture it samples from, or a status explaining what's missing. Surfaces draw calls are a permanent partial case here. Texture content readback gives you the pixel bytes a composited surface displayed, but the draw call itself carries no per-call geometry (bounds, content mask) to position a replayed quad with, so a Surfaces call always reports TextureContentUnavailable regardless of whether its bytes were actually captured. Knowing that up front, from the replay engine itself, matters more than it sounds: a viewer that silently rendered nothing for missing resources would look identical to one that was replaying correctly and just happened to produce a blank frame.
The Element Tree, After the Fact
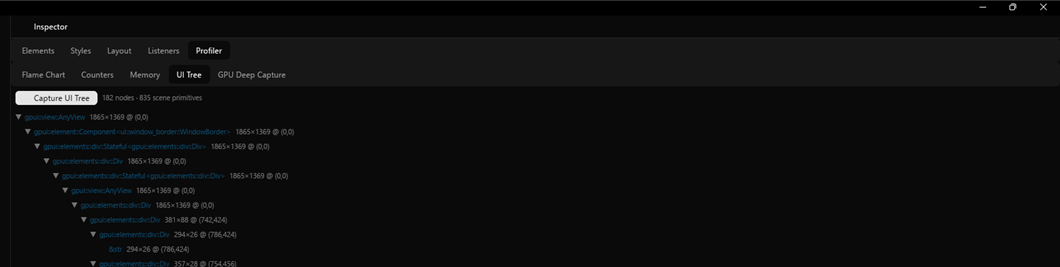
A DeepCapture tells you what the GPU drew. It says nothing about the element tree that produced it. UiTreeCapture fills that gap: every element GPUI's layout pass touched during the captured frame, in the same depth-first order they were visited, each one carrying its concrete type name, a hash of its GlobalElementId (using the identical hash function ElementAttribution already uses, so the two are directly comparable), its resolved layout bounds, and, for div-backed elements with a stable id, a snapshot of its resolved style.
Storing the tree as a flat, depth-annotated list instead of an actual tree keeps the capture itself simple: appending a node during traversal is just a push, no parent pointers to wire up mid-walk. Reconstructing the real shape happens later, in UiTreeReplay, with a single pass and a stack:
Pop the stack while its top is at the same depth or deeper than the current node, and whatever's left on top is the parent. It's the standard trick for rebuilding a tree from a preorder depth list, one linear pass, no recursion. UiTreeReplay also carries the frame's SceneSnapshot, a full copy of every paint primitive the frame produced (quads, shadows, underlines, paths, sprites, backdrop filters, surfaces), deep-copied at the exact point Window::draw would otherwise let the next frame overwrite it. Between the reconstructed tree and the scene snapshot, a captured frame can be inspected entirely offline: no live app, no GPU device, just data.
The Flame Chart, Drawn Instead of Built
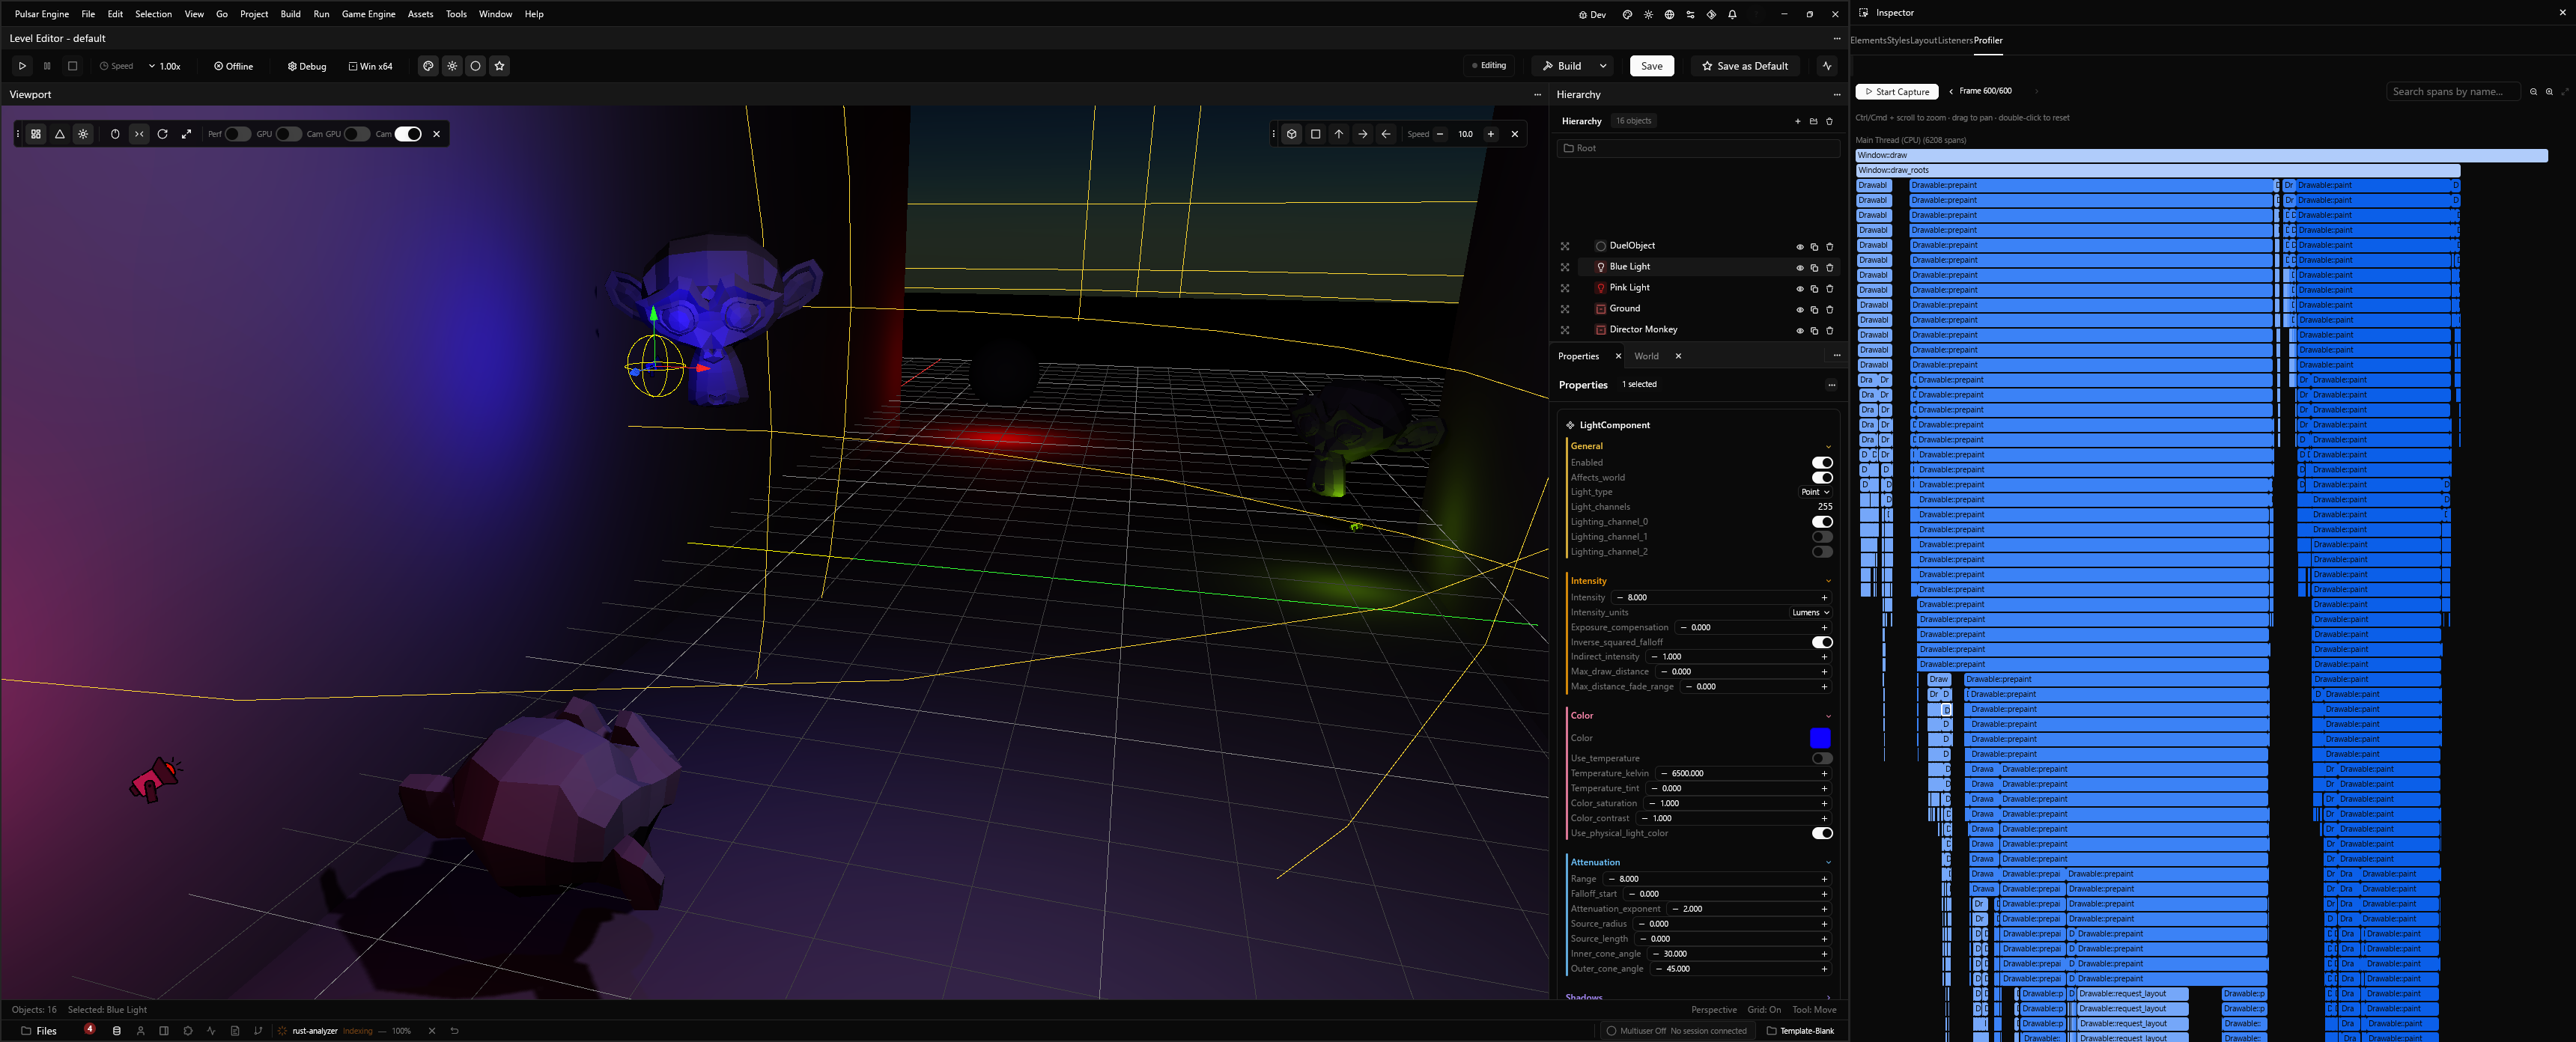
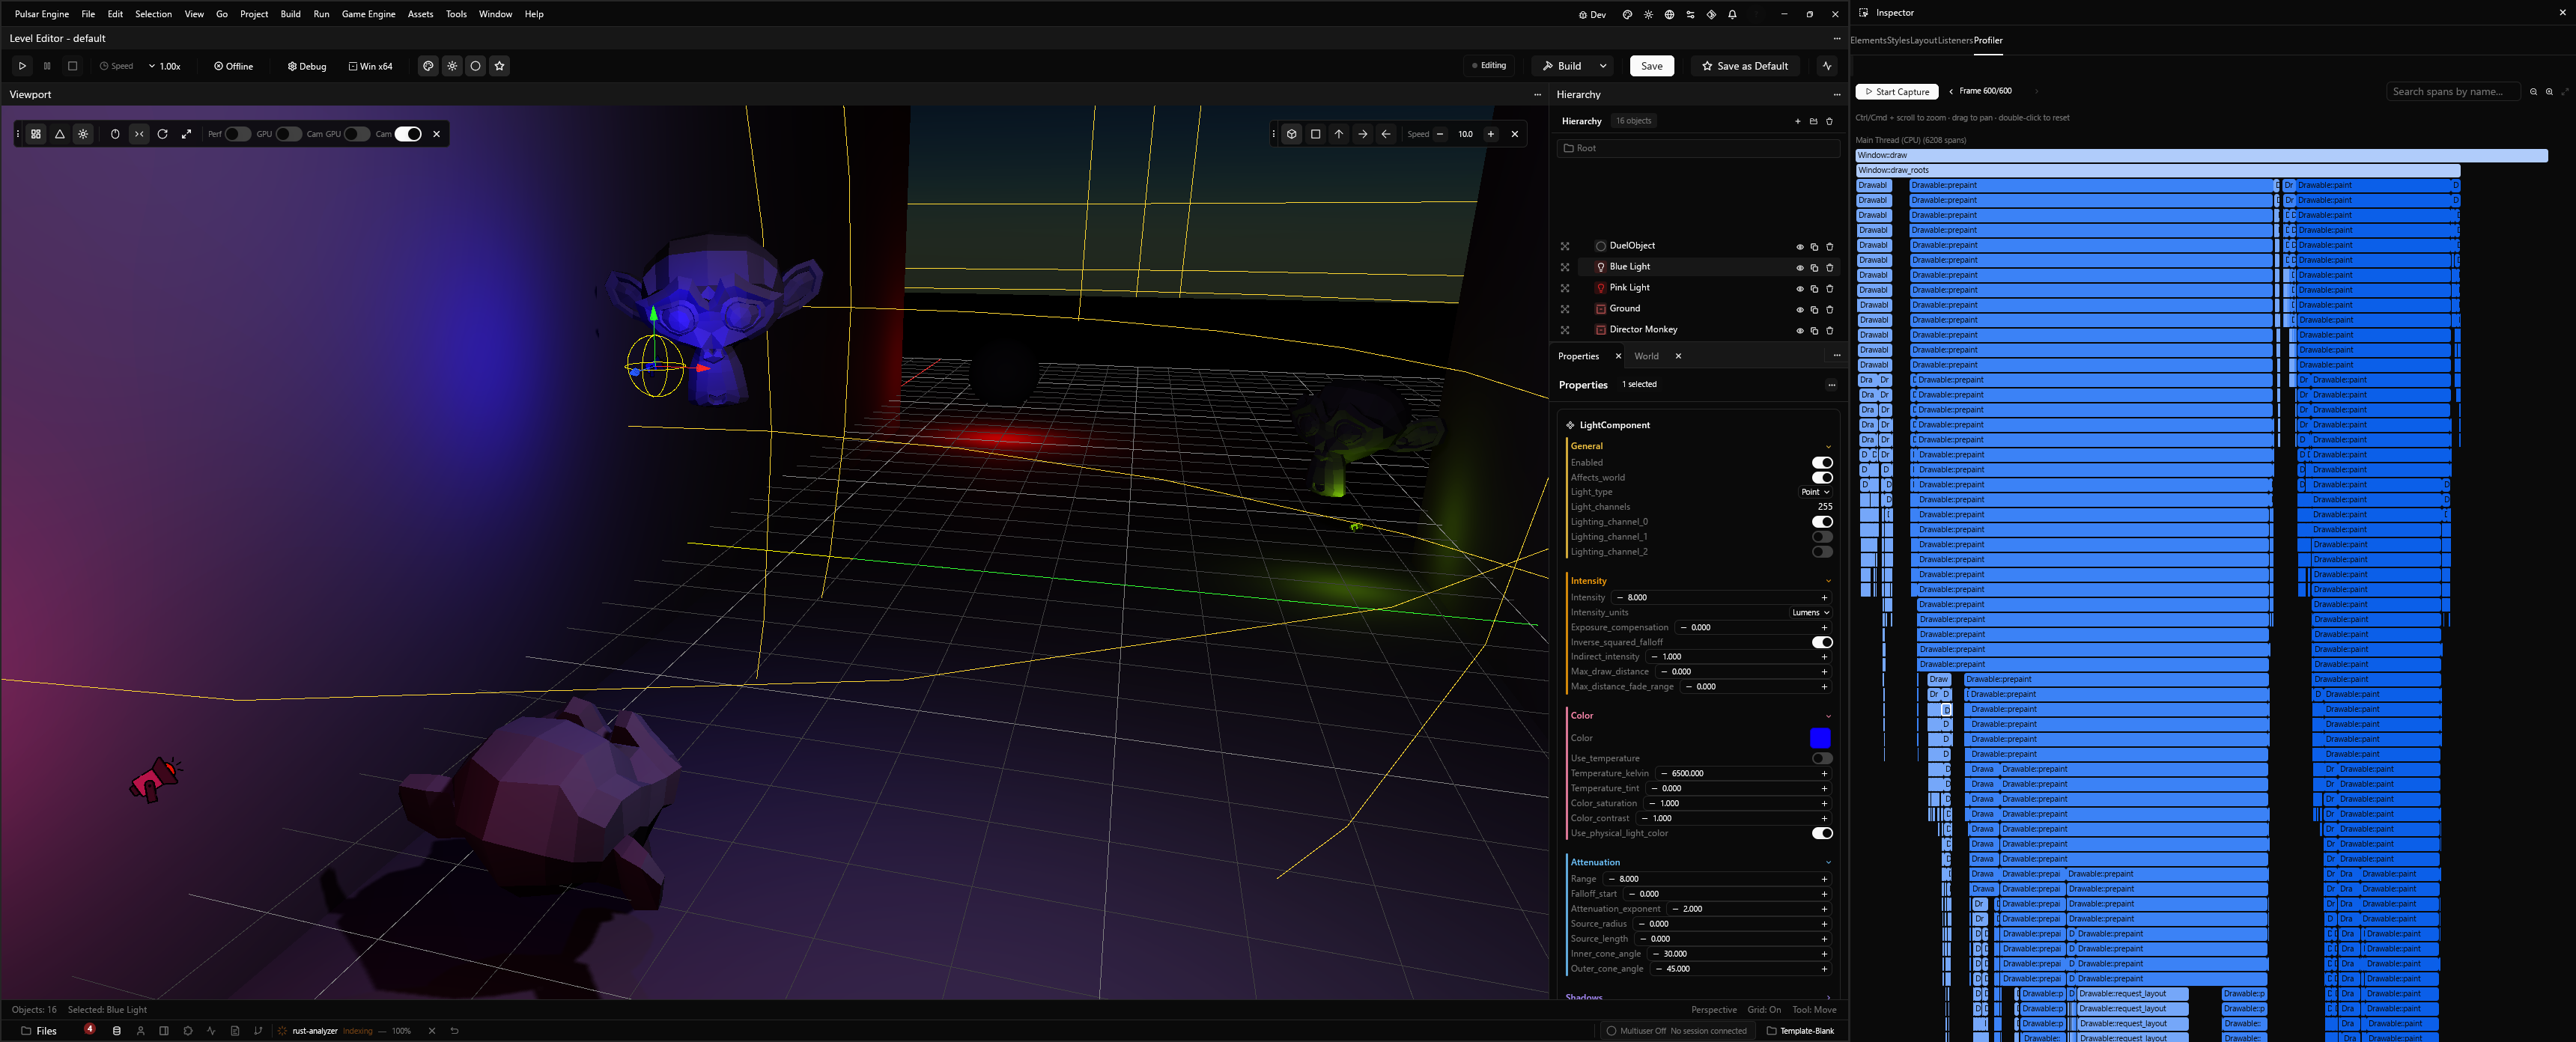
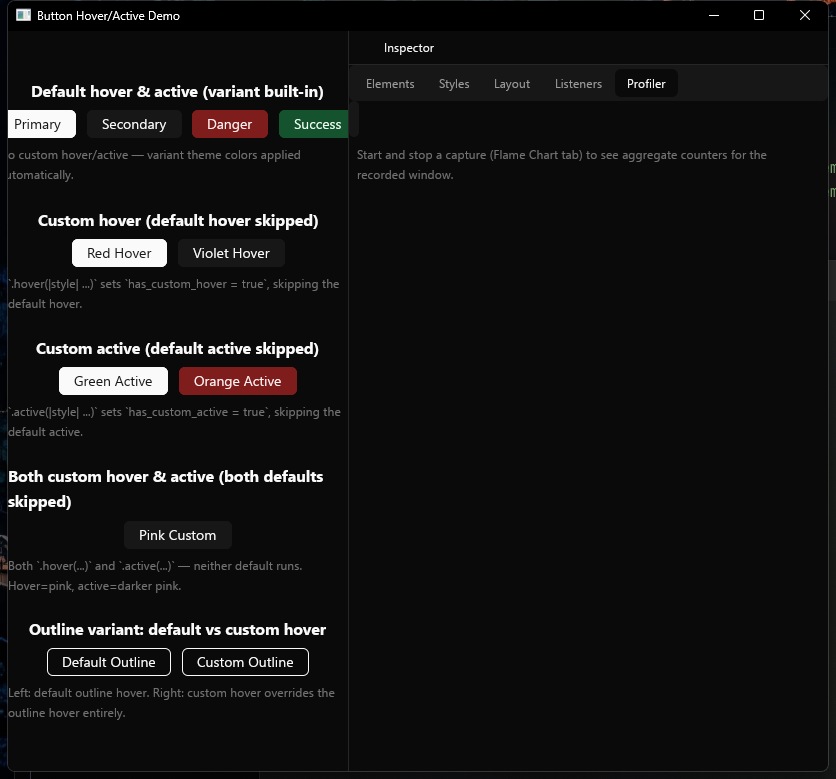
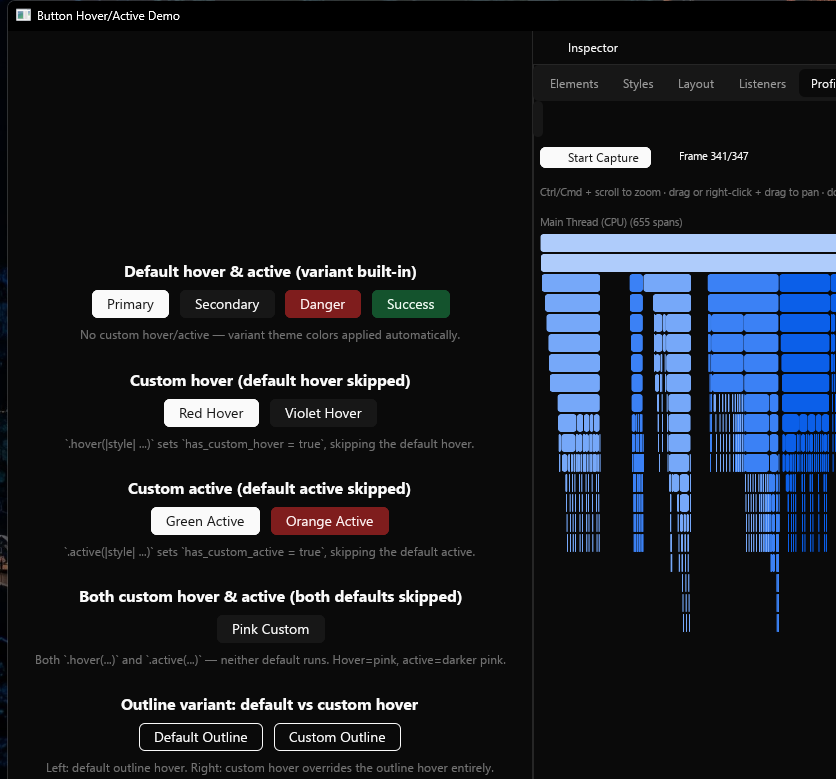
All of the above needed somewhere to live, so it went into a Profiler tab in GPUI's existing Inspector panel: Start Capture, interact with the app, Stop Capture, and get a frame-by-frame flame chart alongside sub-tabs for counters, memory, the UI tree, and deep capture.
The flame chart is the one piece here that couldn't be built the way everything else in the Inspector is built. A typical capture holds hundreds of spans per frame once background threads are counted, and GPUI's element tree is built for interactive UI, not for redrawing hundreds of rectangles as fast as possible on every pan and hover. So the bars themselves are drawn through wgpu_surface, GPUI's mechanism for embedding custom wgpu-rendered content inside an otherwise normal element tree, backed by a small dedicated pipeline:
One BarInstance per visible bar, uploaded as a single storage buffer, drawn with one instanced call per lane. The vertex shader expands each instance into a quad; the fragment shader is a signed-distance-field rounded box, the same antialiasing approach GPUI's own quad shader uses internally:
A thousand bars become one buffer upload and one draw call. Hit-testing runs separately on the CPU, against a parallel array of bar geometry built from the same culled, visible set the GPU instances come from, so hovering and clicking always agree with what the shader actually drew even though neither side depends on the other to do its job.
What's Left
External-device mode still can't correlate GPU timestamps the way owned-device mode does. When GPUI doesn't own the wgpu device, blocking on device.poll to read timestamps back isn't safe, since the owning application polls on its own schedule. A ring buffer of query sets, read a few frames later once the owner's own poll cadence has naturally resolved them, would let external-device captures get real GPU timing instead of skipping it.
The deep-capture replay engine only replays inside the process that captured it. Serializing a capture to disk and loading it into a separate viewer process, the actual RenderDoc model, would separate "capture this before the app does something unrecoverable" from needing the original process to stay alive afterward.
Surfaces draw calls in a deep capture have their texture content but no per-call geometry to position a replayed quad with. Capturing SurfaceParams (bounds and content mask) alongside the existing draw-call stream would close that gap and let surfaces replay as faithfully as every other primitive kind already does.
And the flame chart only ever shows one frame. A view that diffs the current frame's span tree against the previous one's, by name and depth, and reports which spans grew, would turn a capture full of hundreds of frames into a much shorter list of the ones actually worth looking at.