
rust
Building an In-Engine GPU Profiler for Fun and Frame Time
A thorough technical walkthrough of how Helio's built-in profiler works — zero-instrumentation pass timing, GPU timestamp queries, resolve buffer mechanics, staging readback without stalling, and the live telemetry viewer that ties it all together.

You Can't Fix What You Can't Measure
The first time you ship a render-heavy frame and the profiler shows "16.7ms" you feel good. Then you try to figure out whether the shadow pass took 4ms or 8ms or 14ms, and you realize the total number tells you almost nothing useful. Fixing a 16.7ms frame starts with knowing which pass is the problem, and knowing that requires per-pass instrumentation that most engines don't give you for free.
Helio's approach to this is built on a simple philosophy: profiling should be automatic, zero-instrumentation, and always-on during development. You should never have to remember to add timing code to a pass, and you should never have to rebuild to enable it. Every pass in the render graph gets CPU and GPU timestamps written around it by the graph executor, no pass code changes required. The result feeds into a real-time telemetry viewer and an on-screen overlay that shows per-pass frame times in milliseconds.
This post is about how that profiler works, what went wrong during development, and what we learned about GPU timestamp queries, device polling, and the gap between what the API documentation says and what actually works on real hardware.
Why Three Buffers Instead of One
GPU timestamp queries in wgpu follow a pattern that looks like over-engineering on paper but makes sense once you understand the hardware constraints. The GPU writes timestamps into a query set — an opaque hardware resource that the CPU cannot read directly. A second command, resolve_query_set, copies those timestamps into a query buffer with QUERY_RESOLVE | COPY_SRC usage. A third command copies from the query buffer into a resolve buffer with COPY_DST | MAP_READ usage — this is the buffer the CPU is allowed to map and read.
Three hops, one hardware constraint: query sets are write-only on most GPU architectures. You cannot map a query set. You cannot copy from a query set directly to a CPU-mappable buffer. The resolve step is mandatory, and the intermediate copy through a QUERY_RESOLVE buffer is required because the resolve operation produces data in a format that's only valid inside GPU-accessible memory — it isn't directly MAP_READ compatible.
The setup looks like this:
The 256-entry query set supports 128 passes per frame. In practice Helio runs around 20–40 passes depending on the graph configuration, so we're comfortably under the limit. Each pass consumes two query slots: one for write_timestamp at the start, one at the end.
The first time we implemented this we only had two buffers — query set → resolve buffer — and the resolve step produced garbage on every backend except Vulkan. The three-buffer pattern with the explicit QUERY_RESOLVE intermediate was the fix, and it's now the canonical wgpu pattern for timestamp readback.
Timestamp Writes and the Encoder Constraint
Writing timestamps uses encoder.write_timestamp(query_set, index), which requires TIMESTAMP_QUERY_INSIDE_ENCODERS in addition to TIMESTAMP_QUERY. The former is a separate feature flag because some WebGPU implementations only allow timestamp writes inside render or compute passes, not on raw command encoders. wgpu requires both features to be present, and we guard the entire profiler behind a feature check:
When timestamps are unavailable — typically on WebGPU in browsers — the profiler silently degrades to CPU-only timing. The query set and buffers are never created, and write_timestamp is never called. The rest of the profiler infrastructure continues to function; you just get CPU frame times without GPU pass breakdowns.
Helio's GpuProfiler wraps the write calls in begin_pass / end_pass:
The pending_queries deque stores (name, start_index, end_index) tuples. At the end of the frame, resolve_gpu_queries runs the resolve and copy commands, and the indices are used to compute per-pass deltas when the data is mapped back.
Zero-Instrumentation Wrapping
The key design decision is that passes never call begin_pass or end_pass themselves. The RenderGraph executor does it automatically. In execute_with_frame_resources, the profiler wraps every pass:
And before the frame starts:
The CPU-side profiling uses the same wrapping pattern via RAII scope guards:
The scope guard records Instant::now() on construction and calculates the elapsed duration on drop. The combination of CPU scope + GPU timestamp gives a complete picture for each pass: how long it took on the CPU (prepare + any CPU-side work) versus how long the GPU spent executing the recorded commands.
The zero-instrumentation aspect is important because it means profiling never goes stale. Adding a new pass to the graph automatically gives you timing data for it. There's no profiling setup step, no if profiling_enabled gate to add to the new pass's code. It just works.
Blocking Readback and the Polling Problem
Once the command buffers are submitted and the GPU has finished executing, the timestamps need to come back to the CPU. The standard wgpu pattern is:
map_async schedules an asynchronous mapping request. The callback fires once the GPU has finished writing to the buffer, which is detected by device.poll. With wait_indefinitely, poll blocks until the mapping is complete — effectively a blocking readback.
The timestamp period (nanoseconds per GPU tick) comes from queue.get_timestamp_period(). On NVIDIA hardware this is typically 1.0 (timestamp ticks are nanoseconds). On AMD and Intel it varies — typically 50–100 nanoseconds per tick on older hardware, 1.0 on newer generations. We store the period at profiler creation time and use it to convert tick deltas to nanoseconds:
This is where we hit the first real problem: device.poll(wait_indefinitely) is not safe to call when the wgpu device is owned externally.
External Device Mode: Don't Poll What You Don't Own
Helio can operate in two modes. The default mode creates its own wgpu::Device and owns the render loop entirely. In this mode device.poll(wait_indefinitely) is fine — the profiler blocks for a few microseconds to read timestamps, and the frame time increases by exactly that amount.
The second mode is when Helio is embedded into an existing application that owns the wgpu device — for example, GPUI or a custom game engine that creates the device and passes it into the renderer. In this mode, device.poll from Helio's thread causes a "Parent device is lost" panic on DX12 and Vulkan. The external device owner polls on its own schedule, and a concurrent poll — even a single PollType::Poll call — corrupts the driver state.
The fix is a non-blocking readback path that does nothing:
No map_async, no poll, no data read. The previous frame's timings are returned as-is, and the new frame's queries are written on top of the old query set slots. GPU timestamps in this mode lag by 1–2 frames, which is invisible for a real-time overlay. The alternative — issuing a map_async without a matching poll — would queue callbacks that never fire, leaking GPU resources and eventually tripping wgpu's internal watchdog.
The external-device path is not ideal, but it's the correct tradeoff. A profiler that returns stale data is still useful. A profiler that crashes the GPU is not.
The Live Portal
Profiling data doesn't live in a log file. Helio ships with helio-live-portal, a real-time telemetry web dashboard that runs on http://127.0.0.1:3030. Every frame, the renderer exports CPU and GPU timing data as a PortalFrameSnapshot via a non-blocking channel:
The portal renders a live bar chart of per-pass times, a stacked timeline showing how the frame is composed, and a detail pane showing CPU vs GPU breakdown per pass. It's built as a plain HTML/JS app served from an embedded HTTP server — no bundler, no framework, just DOM manipulation and a fetch-based polling loop that picks up the latest snapshot.
The portal starts automatically when the live-portal feature is enabled (default). During development you just open http://localhost:3030 and see every pass's timing with per-frame updates. We've found it catches regressions faster than any automated test — a pass that jumps from 1ms to 3ms is immediately visible as a taller bar.
The On-Screen Overlay
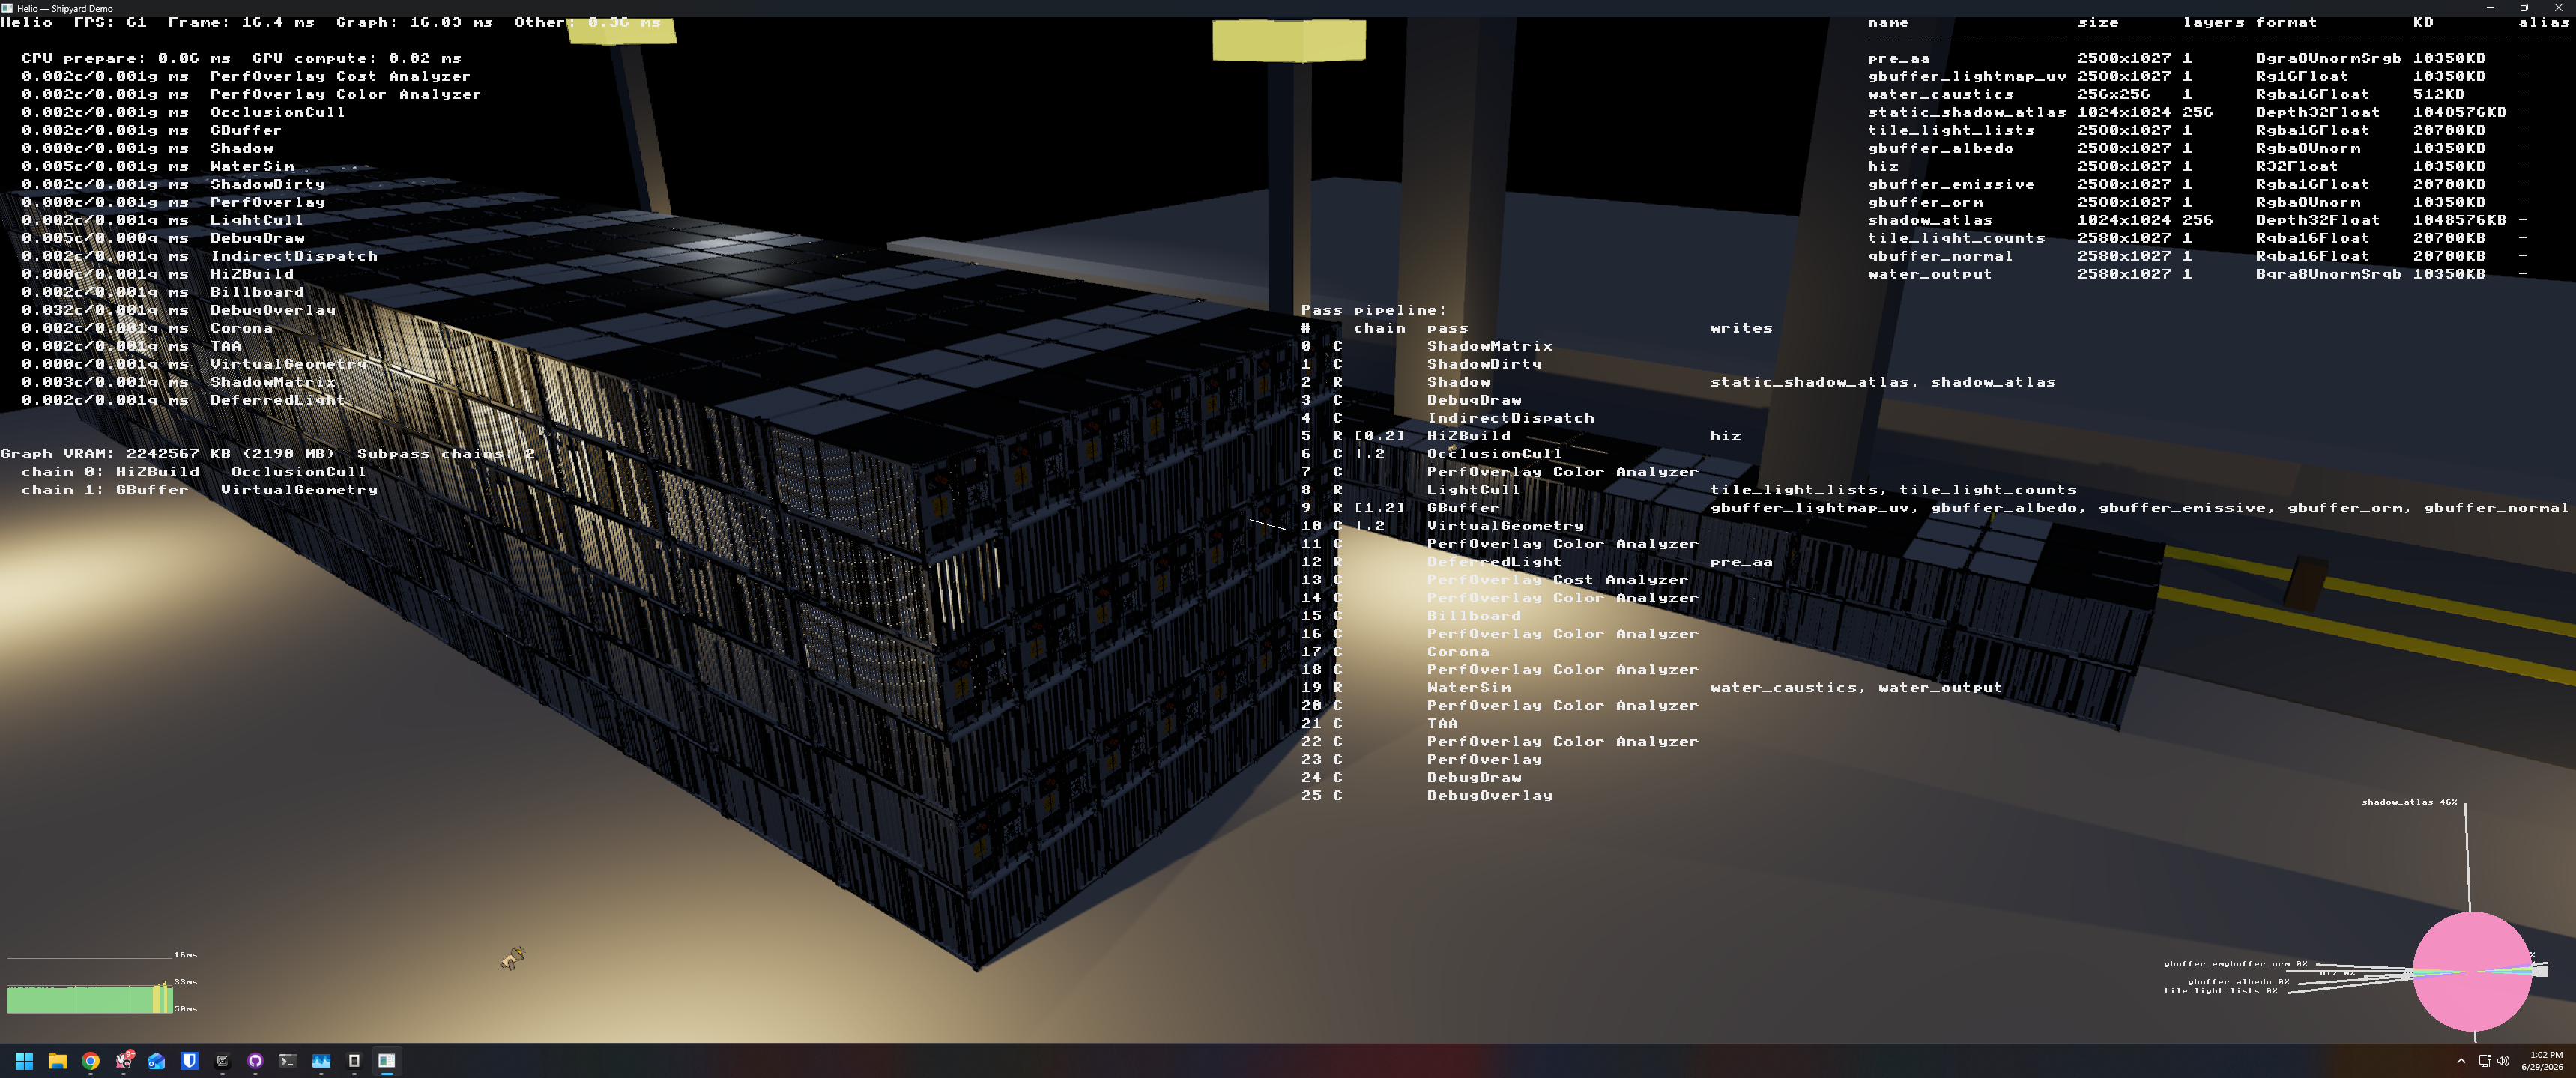
The portal is useful when you have a second monitor. When you don't, Helio's PerfOverlayPass renders the timing data directly onto the frame. It runs as the last render pass, drawing a semi-transparent overlay with per-pass CPU and GPU times, totals, and frame-to-frame deltas.
The overlay is toggled by cycling through PerfOverlayMode variants:
PassOverdraw mode shows the timing table. Each pass appears as a row with CPU and GPU milliseconds, sorted in execution order, with a color-coded bar that shows the proportional cost. Passes that take less than 0.1ms are dimmed. Passes over 5ms are highlighted in red.
The overlay data is shared through an Arc<Mutex<PerfOverlayShared>> — the profiler writes timing data into the shared state, and the overlay pass reads it during its prepare() call. The separation means the overlay doesn't need access to the profiler directly; it just renders whatever the shared state contains.
The DebugOverlayPass: Character Grid Rendering
The timing overlay is one thing, but we also needed a general-purpose debug text rendering system for arbitrary per-frame data. This became the DebugOverlayPass — a full terminal-style character grid rendered as a GPU overlay that accepts text, bar charts, pie slices, and line primitives.
The core is simple: a shared DebugOverlayState protected by Arc<Mutex<...>> that holds a 2D character grid (80×30 by default, configurable up to 280×90). Individual passes and the renderer write text into it during their frame:
The text API is straightforward:
Characters are drawn from a 95-character 8×8 font atlas baked directly into the source as a const byte array. The atlas is 128×64 pixels — 16 columns × 6 rows of 8×8 glyphs — uploaded to a Rgba8Unorm texture at initialization. The fragment shader indexes into the atlas using the per-cell codepoint, sampling the font texture with nearest-neighbor filtering for a sharp pixel look.
The render pass uploads the entire character grid and primitive data to GPU buffers in prepare(), then draws a fullscreen triangle in execute() that the fragment shader converts into per-pixel text output. Because the grid is small (80×30 = 2400 characters at most for the large font, plus roughly 3× for the small font), the upload cost is negligible — about 40KB per frame.
The per-frame overlay layout in the renderer uses this to display pass timings, culling statistics, GPU resource budgets, and the texture table:
The result is a HUD that looks like a terminal overlay — monospaced text, aligned columns, minimal GPU cost.
Culling Statistics: Eight Atomic Counters
The most recent addition to the profiler is the culling statistics system. Helio's GPU-driven culling pipeline — frustum culling, sub-pixel culling, and Hi-Z occlusion culling — runs entirely in compute shaders. The CPU has no idea how many objects were rejected at each stage. That's a problem when you're trying to debug why a scene is expensive: you can't tell if the issue is too many visible objects or too many objects going through the culling pipeline unnecessarily.
The fix is eight atomic<u32> counters in a shared storage buffer:
Each culling pass increments specific counters using atomicAdd:
| Index | Counter | Set by |
|---|---|---|
| 0 | total draws | initial dispatch |
| 1 | frustum culled | frustum cull pass |
| 2 | sub-pixel culled | sub-pixel cull pass |
| 3 | frustum-visible (passed frustum) | frustum cull pass |
| 4 | occlusion culled | occlusion cull pass |
| 5 | shadow casters total | shadow cull pass |
| 6 | shadow casters visible | shadow cull pass |
| 7 | shadow casters occlusion culled | shadow cull pass |
The GPU compute shader atomics are straightforward:
Before the frame, we clear all eight counters with a single clear_buffer:
After the render graph executes, a separate command encoder copies the stats buffer to a staging buffer with MAP_READ, then maps and reads the eight u32 values:
Same poll(wait_indefinitely) pattern as the GPU timestamp readback, same skip-when-external-device guard. The staging buffer readback adds about 0.1ms to the frame when the device is owned — barely measurable.
The stats are rendered in the debug overlay as a formatted table:
This table is the single most useful debugging tool we've added. A scene that seems slow often reveals that 80% of objects are frustum-culled and the real cost is in shadow rendering — which is immediately visible in the shadow-caster stats.
What We Learned About Polling Overhead
The polling question came up repeatedly during development and is worth summarizing clearly.
device.poll(wait_indefinitely) blocks the calling thread until the GPU completes all pending work. In practice on modern GPUs with a command buffer submitted just milliseconds ago, this is near-instantaneous — typically under 100µs. The GPU is usually already done. The poll just confirms completion and flushes the callback queue.
device.poll(PollType::Poll) (non-blocking) is the alternative: it processes whatever callbacks are ready and returns immediately. This is tempting for external-device mode, but it causes the same "Parent device is lost" crash on DX12 when called from a thread that doesn't own the device. The crash is a driver-level guard: ID3D12CommandQueue::ExecuteCommandLists is not thread-safe across multiple threads calling it without synchronization. wgpu's internal polling calls ExecuteCommandLists on behalf of the calling thread, and if two threads do it concurrently, the driver detects the contention and faults.
The rule we settled on is simple: if Helio owns the device, poll freely. If it doesn't, skip all polls and accept stale data. There is no safe middle ground.
For the culling stats, which need current-frame data to be useful, the clear_buffer before the frame and the copy + readback after the frame mean the data is always from the just-completed frame. The poll cost is negligible when owned, and when not owned, the stats simply won't update (they stay at whatever they were last read). In practice, external-device mode is used for editor integration where the GPU profiler is less critical than for standalone game runs.
The Cost of Profiling
Profiling adds cost. The question is whether the cost is worth the information.
Helio's GPU profiler adds exactly two write_timestamp calls per pass. Each call is a single GPU command — a write to a query set slot, which on the hardware side amounts to a timestamp register read and a memory store. The cost is in the noise: roughly 10–15ns per write.
The resolve + copy pipeline runs once per frame, copying 256 × 8 = 2048 bytes from query buffer to resolve buffer. That's a negligible GPU memory operation.
The blocking readback adds device.poll(wait_indefinitely) which, as discussed, is typically under 100µs. The total profiling overhead is around 0.2ms per frame — well within the margin of error for a 16.7ms budget.
The culling stats add eight atomic increments per draw call. Each atomicAdd is a global memory operation with target-dependent cost — around 50–100 GPU cycles on modern hardware. For 10,000 draws that's roughly 500,000–1,000,000 GPU cycles, or about 0.05–0.1ms on a 2GHz GPU. The clear_buffer and staging readback add another 0.1ms.
Total profiling cost: about 0.3ms. The information gained — per-pass GPU times and culling breakdowns — is worth many times that in developer productivity.
What's Left
Async readback without polling. The current deferred-read path for external-device mode discards the GPU timestamp data entirely. A better approach would store the timestamp resolve on a ring buffer of query sets and read N-frames-old data when it's safely available, without calling device.poll at all. The external device owner's own poll cadence would naturally complete the map_async callbacks, and we could pick up the results from a previous frame's slot.
Per-shader cost profiling. The MaterialProfiler already exists in the codebase for the ShaderComplexity overlay mode — it renders test patches with varying roughness, metallic, and light counts, measures actual GPU execution time via timestamp queries, and builds a lookup table of expected cost. This is currently a one-time profiling pass. Making it continuous and per-material would let the overlay show per-pixel shader cost estimates for the actual scene rather than offline benchmarks.
Frame-to-frame delta tracking. The portal shows per-frame absolute values. Showing a delta column — "+0.3ms vs previous frame" — would make regressions even more immediately visible. The compute cost is negligible; it's just storing the previous frame's timing vector and subtracting.
GPU pipeline stage breakdowns. wgpu's TimestampQuery writes are limited to command encoder boundaries. Vulkan's VK_TIMESTAMP_PIPELINE_STAGE_* flags allow finer-grained queries within a single pass — how long the vertex shader took vs the fragment shader. These are available through wgpu's TIMESTAMP_QUERY_INSIDE_PASSES feature on some backends. Adding pass-internal stage queries would let us break down